Key performance indicators (KPI) play a crucial role in trading. KPIs guide us through the system development process and help us to take the right conclusions from a given backtest. A backtest is likely to produces a couple of hundred or even up to thousands of trades. The only way to evaluate the outcome is to look at a set of KPIs that show us how the system is performing.
Furthermore KPIs help us to compare past results with current trades and tell us if the system is running within it’s upper and lower borders. With this post I want to shed some light on my personal key performance indicators and why and how I use them. The interested AmiBroker user can download the source code as well.
In the past I’ve already had a similar post (link). Since then my trading capabilities have evolved as well as my usage of specific KPIs. Nowerdays I do pay more attention to the emotional aspect of trading, hence my personal set of indicators has changed as well.
Practical context
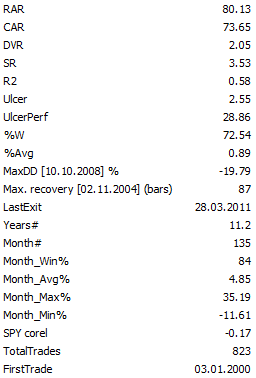
To give the post a practical context I will share the KPIs from two of my systems
A.) SPY: typical mean reversion trading: long and short. Does take counter trend trades as well.
B.) NDX100: trading Nasdaq100 stocks with a momentum driven approach, weekly rebalancing, long only

As you see, those two systems are very different in their KPIs. By definition they produce a very different set of trades. The SPY mean-reversion system is resulting in a set of very similar trades due to its short-term focus combined with its timing approach. On the opposite the NDX100 system is creating low consistency trades with large outliers as it’s riding the momentum wave..
Let’s talk KPIs
Often times you hear/read from people that they only trade strategies with a Sharpe Ratio greater X or a maximum draw down of no more than Y. Based on my experience I can say:
KPIs have to be evaluated in the context of the given strategy type AND the person who is investing his/her money.
Bellow you find a list of indicators I’m using incl. a brief description how I’m using those:
- Trades: For a serious evaluation of a strategy I like to see at least a couple of hundred trades over the course of at least 10 years. Of course a strategy should work before the ten years window as well, but for performance evaluation the last ten years are most relevant. I decided to focus on ten years, because this includes two major bear market (.com / financial crisis). A strategy that has created less than a few hundred trades isn’t reliable enough (for me).
. - Avg. (%) -Average % return per trade: I like to distinguish between long and short trades. The job of this KPI is to tell me if the size is too small, no more than that. A size south of 0.5% before slippage and commission can hardly be traded (unless you have super strong execution capabilities).
. - Correlation: I like to see how a strategy is correlating with its benchmark index. Typically I use the SPY ETF as a proxy..
- Sharpe: Sharpe ratio is one of the KPIs to evaluate risk, though you have to be aware of its flaws. I do define risk (mainly) as down-side volatility of my equity curve. That’s different to many other people who talk risk mainly in the context of maximum draw-down. Upside volatility is less of an issue for me. However, the Sharpe Ratio is looking at the consistency of trades and will therefore penalize upside volatility. As you can see in my two strategies, they have very different Sharpe Ratios 1.3 vs. 3.5. The fairly low Sharpe Ratio of the NDX100 Momentum strategy can been seen by its huge discrepancy between the best and the worst trade. The best trade has made 82% and the worst trade -52%, those are huge outliers and result in a fairly low Sharpe Ratio. In comparison the SPY mean reversion strategy has it’s best trade with 11% and its worst trade with -11%. Though I think the NDX100 strategy deserves to be trades as momentum strategies tend to have lower Sharpe Ratios.
. - CAGR (%): That’s what we make our living from, returns. During the design / development phase I’m not very focussed on this. I try to evaluate returns in the context of risk. As you can see, my SPY mean reversion strategy has a lower CAGR but higher Sharpe Ratio. While the NDX100 momentum strategy is just the opposite. Again, KPIs have to be evaluated within the context of a given strategy type.
.. - Equity R2: That’s a pretty handy tool. It measures the straight line fit of the equity curve. Outcome can be anywhere from 0 to 1. Having a 1 means 100% fit of the equity curve to a straight line. Speaking in system development: the fewer drawdowns the system has the higher R2 will be. Yes, a max drawdown is already measured by MaxDD%, but MaxDD% reflects only a single point time within any given equity curve where R2 takes all peaks and valleys into consideration = consistency = smoothness of returns. Depending if a system test is compound vs. non compound one gets a very different result.
.. - DVR: = Sharpe Ratio * R2. I got this idea from David Varadi and his excellent blog. I use DVR a lot during the design and development phase in order to judge if a given modification has positive impact on the strategy.
.
Developing a great system is one thing, trading it consistently is a very different thing. The KPIs bellow capture the emotional side of trading.
- .Max.DrawDown(%): During my system creation process I’m not at all focussed on limiting the maximum draw-down. Usually the Max.DD can be attributed to a single black swan event = something you can not predict or control, e.g. Flash Crash or 9/11. Designing a system in a way to avoid being invested at those specific events will very likely end in over-optimization.
- UPI (Ulcer Performance Index): One of the less known indicators. You can find an explanation here (link). The interesting part of the UPI is it’s fact that it’s focusing only on downside volatility in comparison to returns. One needs to be aware that UPI is dependend on the sequence of returns (huge difference to Sharpe Ratio as well). While we know for sure that the future won’t look like the past, the Ulcer Index can act as a true measurement of pain (in hindsight). I use UPI in combination with Equity R2 lot.
- Win (%): Percentage of winning trades. That’s one of my most important emotional success measures (at least for now). I need to have 60+% winners, otherwise I find it difficult to trade a system (as you can see with the two examples above).
. - Month Avg(%) / Win(%): I do evaluate the performance of my trading (-systems) on a monthly basis. I do neglect daily trading returns, thereby the day-to-day moves have less of an impact on my personal live and mood. I want to see about 75% of the month being positive.
. - MAX recovery (bars): That’s a KPI I created for my personal situation. It measures the recovery period to a new high since the last high. During that period the max.DD% doesn’t necessarily need to occur. It’s just a measurement of maximum sideway move (without new equity highs).
I ended-up with a set of tailored personal KPIs that fit my trading style as well as my level of trading experience. I’m sure I won’t have found the final set as my trading continues to evolve and so do my KPIs.
AmiBroker

For the AmiBroker users among the readers I’ve attached the code to produce these KPIs (AmiBroker KPIs)


hi Frank,
nice post !
have you considered some KPI which shows some performance relative to a benchmark ?
For example, i have seen in a couple of places (for example in some past marketsci postings – dont recall which offhand now) a couple of KPIs like:
– avg return on days when benchmark (say SPY) declined
– avg return on days when benchmark rose
And then of course, you could easily calculate correlation to benchmark.
the benchmark for instance could be any specific symbol in Amibroker.
I have found that this gives a feel of how much ‘beta-capture/following’ the model has.
regards
bgpl
Hi Badri,
thanks for the feedback and the nice idea.
Once I got a little more time I will look into it and notify you if relevant.
Frank
R^2 can actually be quite different depending on the timeframe used. For example, I have a macroeconomic momentum-based strategy that is extremely volatile over S/T timeframes (days/weeks/month), but is actually my most consistent strategy over longer timeframes (quarters/years). On the other hand, I have an equity long/short strategy that has extremely low volatility over shorter timeframes, but varies greatly when looking at annual returns (some years essentially flat, others huge winners).
In effect, the strategy with the MOST short-term volatility actually has the LEAST long-term volatility, and vice versa.
So it might help to look at R^2 across multiple timeframes. For example, to calculate S/T vol you might look at daily R^2 for each month separately (or on a rolling 21d basis), and then average the R^2 for all months. This describes day-to-day and week-to-week swings. For L/T vol, you could look at the R^2 of quarterly or annual returns. This describes the long-term consistency of the strategy.
Even though both describe “equity curve volatility” or “consistency of returns”, they are actually two very different things. Using a single R^2 obscures this.
Hi Ben,
thanks for the nice idea. Once I got a little more time I will look into it.
Frank
HI
I have a doubt that perhaps someone has thought about..
Which is the importance of the walk forward study?
All the books I’ve read say that the only reliable backtest are the Out of sample backtest. Ok.
But, regarding swing trading systems, I am not sure of that.
An example:
My best system (at the date) is a very simple swing-trading system that obtains, buying 5 high liquidity stocks.:
CAR 54, MaxDD -28 (2001 to 2010)
I like the system because its profits are very stable when I change the optimized variable.
After that, I made the Walk forward study:
IS size: 1 year. OOS size: 3 months.
CAR 28, MaxDD -31 (2001-2010)
Wow!. The results drops to nearly half!
But, observing the walk forward study, I don’t like the changing of the variable every 3 months..
So.. what if I try the best variable in 2001-2005 and apply to 2006-2010?
(This is, IS 5 years, OOS 5 years)
Then, I find that the IS optimized 2001-2005 obtains the same value to my main variable than IS optimized 2001-2010. This is a value that is stable along 10 years, very different regime years..
And, if I compare all the backtests:
Walk forward backtest 2005-2010 (IS 1 year, OOS 3 months): CAR 24, MAxDD -25
Optimized backtest 2001-2010 (IS 1 year, OOS 3 months): CAR 54, MaxDD -28
Walk forward backtest 2005-2010 (IS 5 year, OOS 5 years): CAR 51, MAxDD -28
In other words, probably it is better to use an optimized variable along many years than to use the Walk forward method changing the values of the variable in short OOS sizes (3 months)
At least in stable systems, as it is mine..
I hope.
Hi Gonzaga
I don’t use Walk Forward optimization at all. So I can’t give you any advice here.
Frank
You don’t use Walk Forward? :-O
I am impressed!
Every book I’ve seen says that Walk forward tests are a ‘must’..
Why don’t you use them?
I think you have a great knowledge in the science-art of designing systems, so yo have shocked me..
(although my own research makes me to trust less in Walk forward’s, as I’ve posted)
Greetings!
Hi Conzaga,
I test my systems over the course of 10 years. I’m not trying to optimize for the single PERFECT indicator value. I’m trying to understand the logic behind the indicator setting, e.g. RSI(2) for short-term mean-reversion and RSI(5) for intermediate-term mean-reversion (That’s just a plain stupid example)
Frank
In my opion there is a error/mistake in calculating the sharpe ration and the R² to a straigth line. It both measure your equity in relation to a “straight line”.
BUT is a straight line really the equity curve you want to achive.
I say no.
What you want to have is a constant percental increment each same period!
E.g.:
If you equity was 50k last year and your account is now 100k (:-) ) you want to achive 200k next year, not only 150k.
So it would be better to calculate a deviation or correlation to a polynom function i.g.: (1+p)^n rather than to a straight line.
odeedo
Hi Odeedo,
I agree. Since I made this post I changed my equity straight line fit KPI (R2). It’s now calculating R2: straight line compared to the sum of ROC1.
AmiBroker is calculating Sharpe Ratio based on trades, i’m calculating my Sharpe Ratio based on the 1 day ROC.
Frank
Hello Franck
i try to modify my formula to calculate R2 with ROC1
I use
Days = BarsSince(DateNum()==entryd);
ROCe = Sum(ROC(e,1), Days);
r2 = Correlation( e, ROCe , LastValue(RefLine-1) ) ^ 2;
or r2 = Correlation( LastValue(e), LastValue(ROCe) , LastValue(Days) ) ^ 2;
but R2 data is empty
can you tell me how you calculate this metric ?
Thanks
Hi,
I do use:
e = bo2.equityarray();
refline = Cum( 1 );
eLog1 = log(e/Ref(e,-1))*100;
r2 = Correlation(Cum(elog1),Refline,Daysn-1) ^ 2 ;
Frank
Hello Franck,
I used your code in Amibroker 5.2.
The AFL verify syntax said line 47 is error. @@||
>>Years = DateTimeDiff(Lastdate,trade.entrydatetime) / 31557600;
But I can not find any error in this line …